Introducing the 2023 Cluster Analysis

The 2023 “Full” edition of our “Cryptocurrency in Retail: Consumer Adoption Report,” which you can find here, introduces a comprehensive Cluster Analysis, a feature first included in our 2022 report. This article briefly outlines what Cluster Analysis entails and its application in marketing research. We also detail the analytical methodology employed in our study. Finally, we describe the Cluster Analysis section of our 2023 Report, highlighting the types of charts and data presented and their significance.
What is cluster analysis and how is it used for marketing research?
Cluster analysis, a powerful statistical method in marketing research, groups customers or market segments with similar characteristics. This technique identifies patterns and trends within customer data, providing valuable insights for crafting marketing strategies and tactics.
Take, for instance, a dataset containing customer demographics, purchasing behaviours, brand preferences and other relevant information. Cluster analysis enables the segmentation of these customers into distinct groups based on shared traits. It also helps in understanding the unique qualities of each group, distinguishing them from others. These insights are very useful for tailored marketing initiatives, such as customising products or pricing for specific segments, or crafting targeted marketing messages and promotions. These targeted efforts are more likely to resonate with each group, delivered through the most effective channels.
In simpler terms, cluster analysis sorts a large population into smaller, more homogeneous groups based on their shared attributes. This approach is more nuanced than basic segmentation models, like categorising solely by age or income. The strength of cluster analysis lies in its ability to consider multiple variables simultaneously and understand the interplay between these variables, leading to more refined and effective marketing strategies.
Cluster analysis methodology used for our 2023 report
The 2023 Cluster Analysis in our report employed a method tailored to the specific nature of the data and research objectives. Among various techniques, we considered K-means, hierarchical clustering, and density-based clustering, each with unique advantages and limitations. The final selection hinged on the research needs and data characteristics.
We adopted the K-Prototypes algorithm, a variant of clustering that efficiently groups similar data points, or “prototypes.” The ‘K’ signifies the number of clusters formed by the algorithm. K-Prototypes begins by randomly selecting K initial prototypes and iteratively assigns each data point to the nearest prototype. Following each assignment, the prototype positions are recalculated to represent the average of all associated data points. This process continues until the prototypes stabilize or a predefined stopping criterion is reached.
A key distinction of K-Prototypes, compared to algorithms like K-Means, is its ability to handle both numerical and categorical data. It effectively groups data points with diverse attributes, such as numerical values (age, income) and categorical values (gender, location).
K-Prototypes clusters data points by considering a mix of numerical and categorical values, making it particularly suitable for our diverse dataset.
Our Crypto-shopper survey, encompassing 125 questions, gathers a mix of numerical and categorical data, including demographics like gender, employment status and country of residence. For the 2023 cluster analysis we analyse 32 different variables from the survey, including levels of domain knowledge, shopping frequency, education level, income level, country income level. This diversity in data types makes K-Prototypes an ideal choice for our analytical approach.
2023 consumer spending of crypto cluster analysis
The Cluster Analysis Section in our report is methodically divided into three insightful segments.
1. Mapping of crypto consumer segments
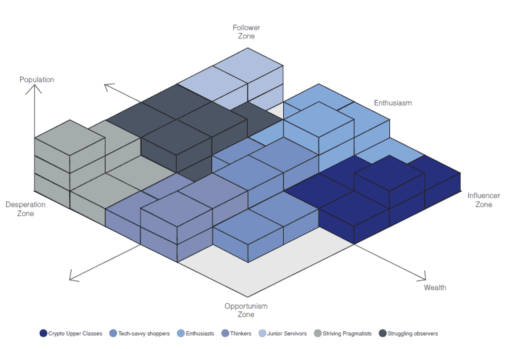
The first section of our report features a chart that shows seven Crypto Consumer segments. These segments are plotted on a chart using two main factors: Wealth and Enthusiasm. These factors create a two-dimensional (x-y) layout, dividing the segments into four main areas. This layout helps show how the segments differ from and relate to each other. We also use a third dimension, shown as the z-axis, to represent the size of each segment’s population. This three-dimensional view makes it easy to see how the segments compare in size and characteristics.
Figure 1 – Cryptorefills Consumer Report 2023 Cluster Map
2. In-depth segment analysis
The second section delves into a detailed description of each of the seven identified segments. We explore commonalities in demographics, preferences and behaviours within each segment, painting a vivid picture of their unique characteristics. This includes traits such as wealth levels, blockchain knowledge, product preferences, etc. To enhance understanding, we juxtapose each group against variables like Enthusiasm, Wealth, Blockchain Knowledge, Education Level, Population Size, and Crypto Shopping Frequency. This comparison facilitates an instant visualization of intra-group similarities and inter-group differences based on these crucial macro traits.
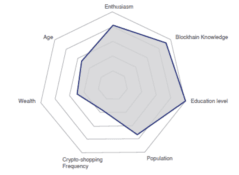
Figure 2 – Cryptorefills 2023 Consumer Report Example Segment
3. Reanalysis of consumer report data by segment
The final section reexamines key data and charts from the Consumer Report, now segmented according to the Cluster Analysis. This segmented perspective offers a nuanced view of preferences and habits, such as the use of the Lightning Network or cryptocurrency spending patterns, tailored to each segment. This segmentation reveals that certain preferences or habits may be significantly more prevalent in specific segments, yielding valuable marketing insights.
Correlation and regression analysis
The correlation analysis revealed negative correlations between purchase frequency and all knowledge variables, with “Knowledge on Obtaining Bitcoin” showing the strongest negative correlation at -0.11. This implies that increased knowledge or expertise in specific areas might correlate with a decrement in purchase frequency. The regression model, detailed in the full report, explained approximately 11.63% of the variance in purchase frequency, suggesting that other factors play a significant role in determining purchasing behaviour.
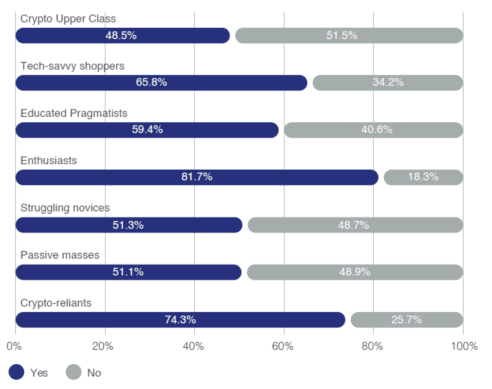
Figure 3 – Example 2023 use of Lightning Network by Consumer Segment
Availability and relevance
This comprehensive Cluster Analysis is exclusively available in the Full Edition of the Cryptorefills Labs “Cryptocurrency in Retail: Consumer Adoption Report 2023”. It includes a high-level mapping of the seven segments, along with 36 detailed charts and graphs. This analysis is particularly beneficial for crypto and web 3 marketers, as well as payment managers exploring cryptocurrency acceptance. Our team welcomes inquiries and can be contacted through our provided form for further discussion and insights.
Sources
Anderberg, M. R. (1973). Cluster analysis for applications. New York: Academic Press.
Chaturvedi, A., & Gupta, M. (2019). A Comparative Study of K-Means and K-Prototypes Algorithm for Categorical Data. International Journal of Computer Applications, 175(4), 16-20.
Everitt, B., & Hothorn, T. (2011). An introduction to applied multivariate analysis with R. New York: Springer.
Hahs-Vaughn, D. L., & Nachtigall, R. D. (2010). Cluster analysis in research. Journal of Educational Research, 103(5), 323-337.
Huang, Z. (1998). Extensions to the k-means algorithm for clustering large data sets with categorical values. Data mining and knowledge discovery, 2(3), 283-304.
Jain, A. K., & Dubes, R. C. (1988). Algorithms for clustering data. Prentice-Hall, Inc.
Kaufman, L., & Rousseeuw, P. J. (1990). Finding groups in data: An introduction to cluster analysis. New York: Wiley.