Where crypto actually gets spent, and what it gets spent from

For a technology introduced as electronic cash, cryptocurrency has produced remarkably little evidence of anyone using it as cash. Researchers who want to study crypto payments have had to choose between asking people what they do, which produces small surveys and unreliable memories, and watching blockchains, which mix genuine purchases with trading, treasury flows and speculation until the payment signal disappears. Central banks have built impressive datasets on crypto trading apps. Nobody, as far as we can tell, has published an analysis of actual purchases, at scale, across countries.
We are in a position to change that, because we run the till. Cryptorefills has sold everyday digital goods and services for cryptocurrency since 2018, in more than 180 countries. Every completed order records three things researchers cannot normally see together: what the customer bought, which payment rail they used, and where they were. Our new working paper, The Geography of Real-World Crypto Spending, analyses that ledger, aggregated to country level and stripped of anything commercially or personally identifying. The countries themselves are anonymised, for reasons the paper explains. What remains is enough to answer a simple question with unusual precision: when people around the world reach for crypto at a checkout, what exactly do they reach for?
The answers surprised us, and we had the data.
Tron is not emerging-market money
Start with the story everyone knows. In the industry's telling, USDT on the Tron network is emerging-market money, the digital dollar of the Global South. It is a tidy narrative, and our data declines to support it. Tron's share of checkout is essentially flat across income groups. Rich-country customers use it at much the same rate as customers in lower-middle-income economies. The correlation between a country's Tron share and its income is indistinguishable from zero. Tron is popular, and its popularity is unusual in our data for having no geography of income at all. Whatever Tron users have in common, it is not poverty.
The real divide is custody
What does vary with income, and strongly, is something the industry talks about far less: custody. In plain terms, whether the customer pays from an account held at a crypto exchange, the way one pays from a bank account, or from a wallet they control themselves on a public blockchain. In lower-middle-income countries, custodial exchange payments average 64 per cent of checkout. In high-income countries the figure is 19 per cent. The relationship holds across the full range of national income, survives statistical controls for inflation and remittances, the two forces most often invoked to explain emerging-market crypto demand, and reappears under every method we throw at it. The divide in global crypto spending is not primarily about coins or chains. It is about where the money lives before it is spent.
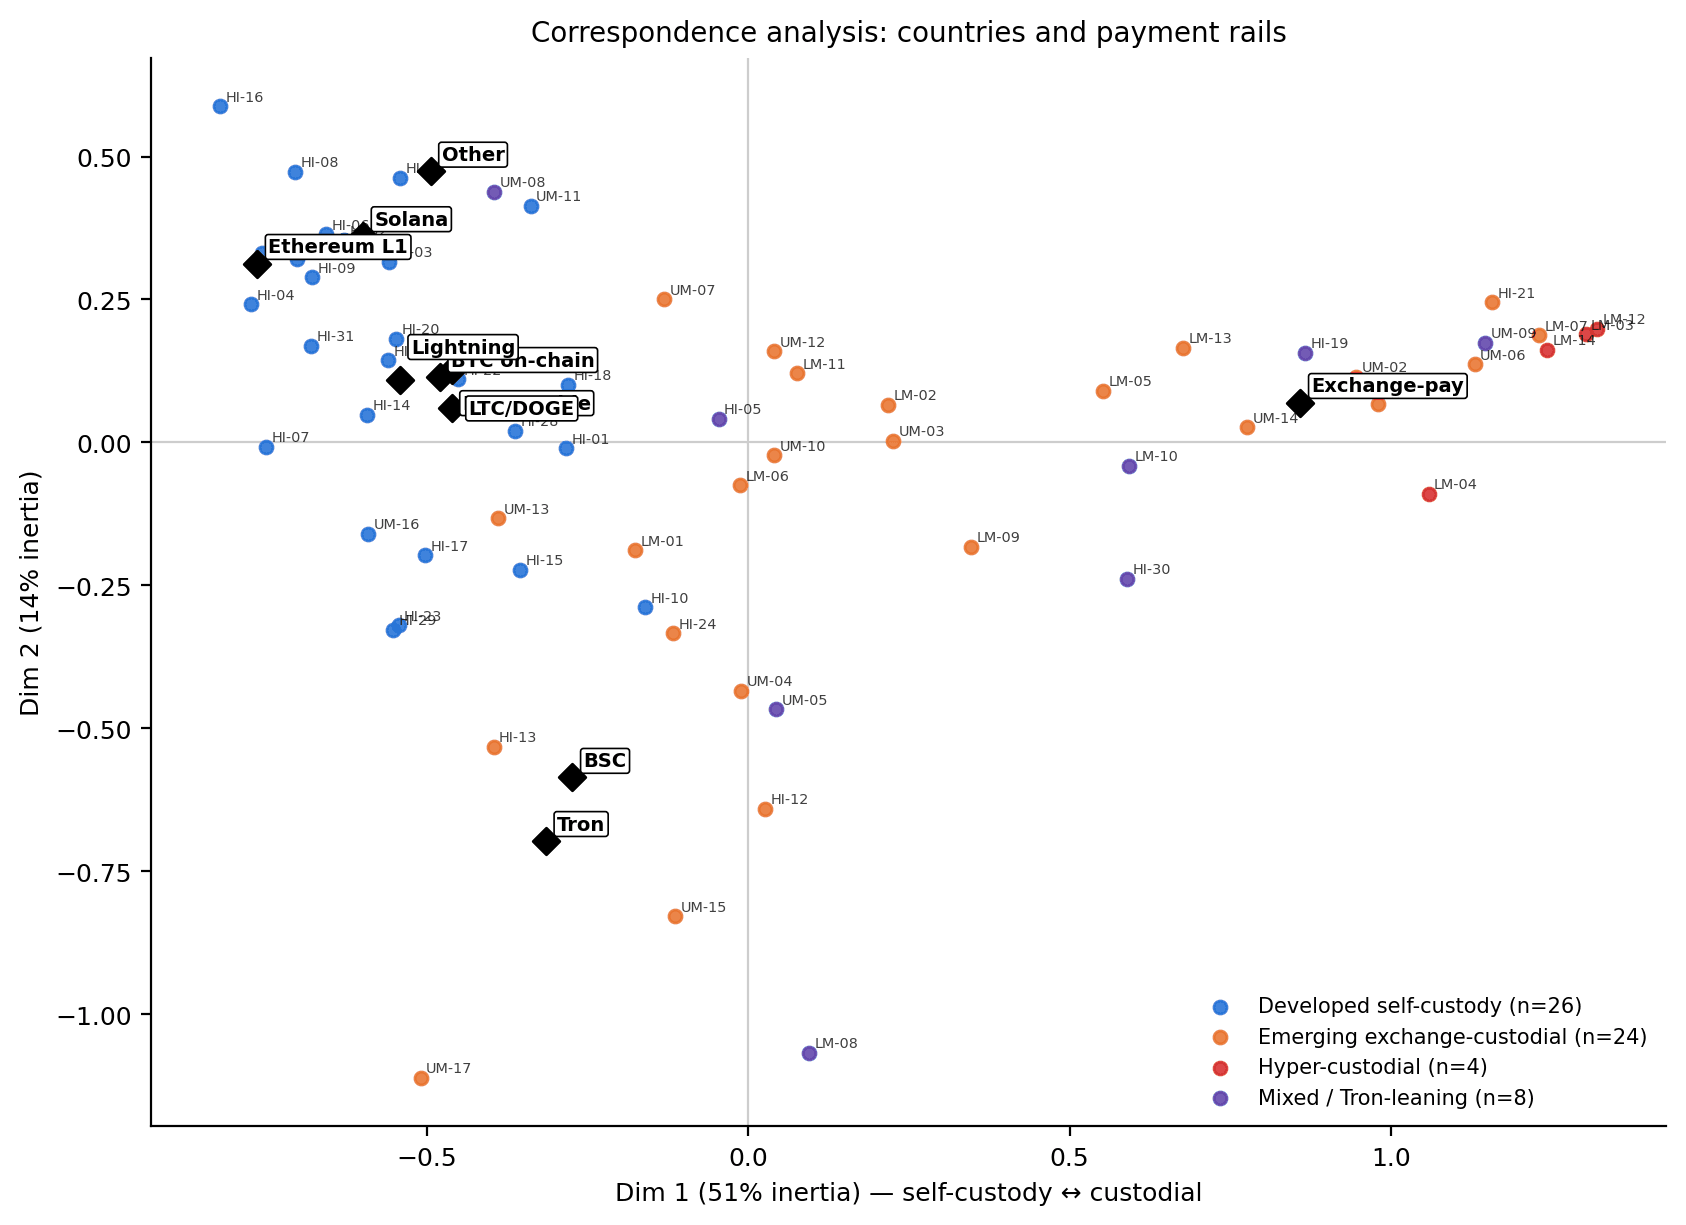
Figure 3 from the paper. Countries and payment rails in a shared plane. The first dimension, carrying 51 per cent of inertia, runs from self-custody to custodial. Exchange-pay anchors one pole and every self-custodial rail the other.
The direction of that divide is worth sitting with, because it inverts a common assumption. Self-custody, holding your own keys, is often described as the province of the ideologically committed. In our data it is above all the province of the rich world, and it concentrates in the newest and most consumer-friendly networks: Solana, Ethereum layer-2s, Lightning. Customers in wealthy countries behave like early adopters of a maturing technology, with good apps, cheap data and easy on-ramps. Customers in poorer countries, who are routinely portrayed as crypto's true believers, mostly pay from exchange accounts. For millions of people, the centralised exchange is the wallet, the bank and the payment app in one. Binance has lately been making the same observation about its own users. Our merchant data confirms it from the other side of the counter, on independent evidence.
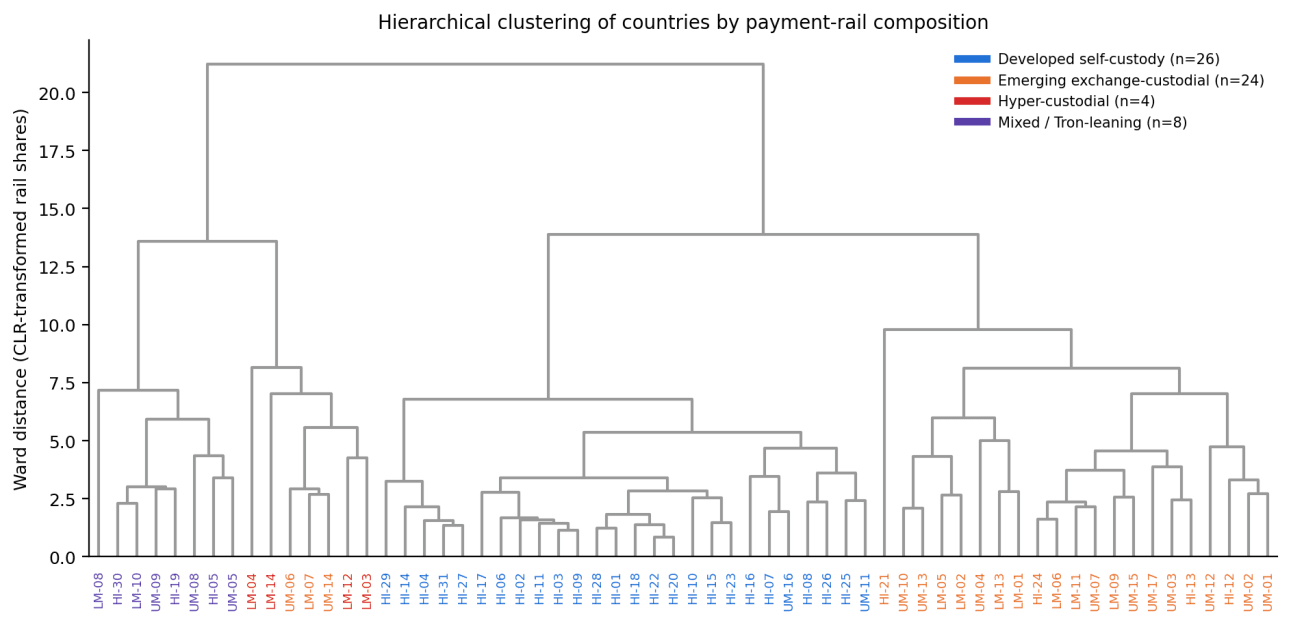
Figure 2 from the paper. Clustering countries on their payment-rail mix yields four regimes: developed self-custody, emerging exchange-custodial, hyper-custodial and a mixed, Tron-leaning group that spans all income levels.
Bitcoin at the checkout never recovered
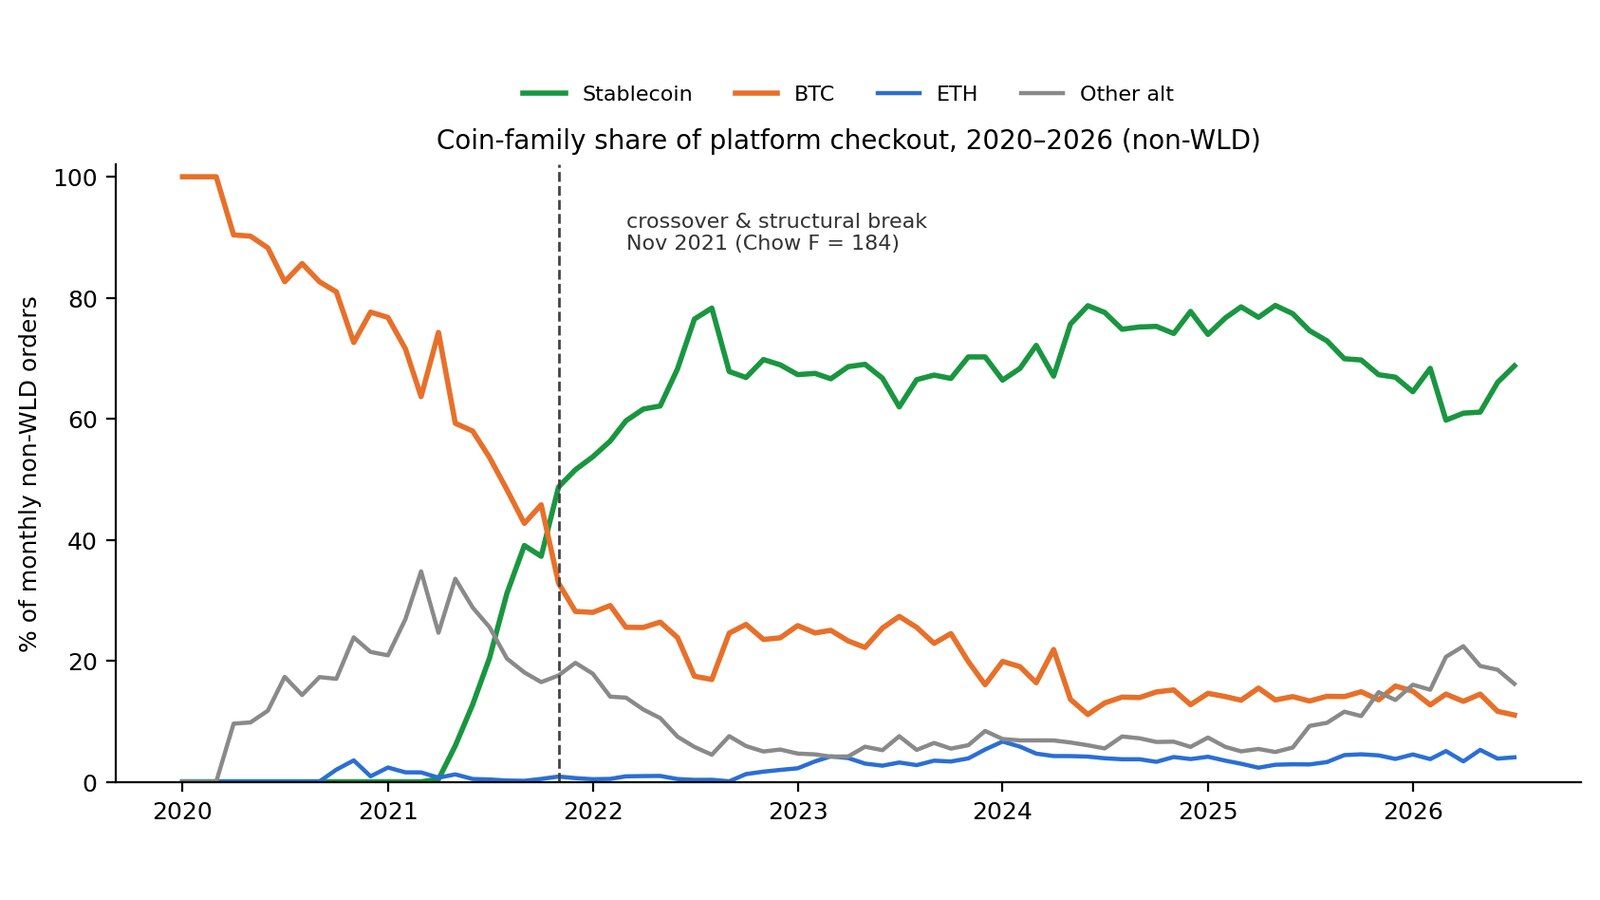
The paper's third finding concerns time. Our checkout was essentially all Bitcoin in 2020. Today roughly two thirds of everything sold on the platform is paid for in stablecoins, and statistical testing dates the break precisely: November 2021, the month the last crypto bull market peaked. Bitcoin's price went on to recover and exceed its old highs. Its role at our checkout never did. We are careful about what this series can and cannot show, since the menu of payment options expanded over the period and some of the shift reflects new supply as well as demand. But the direction matches what payment processors report across the industry, and the message is hard to miss. As an asset, Bitcoin has thrived. As everyday money, it has been quietly replaced by tokenised dollars.
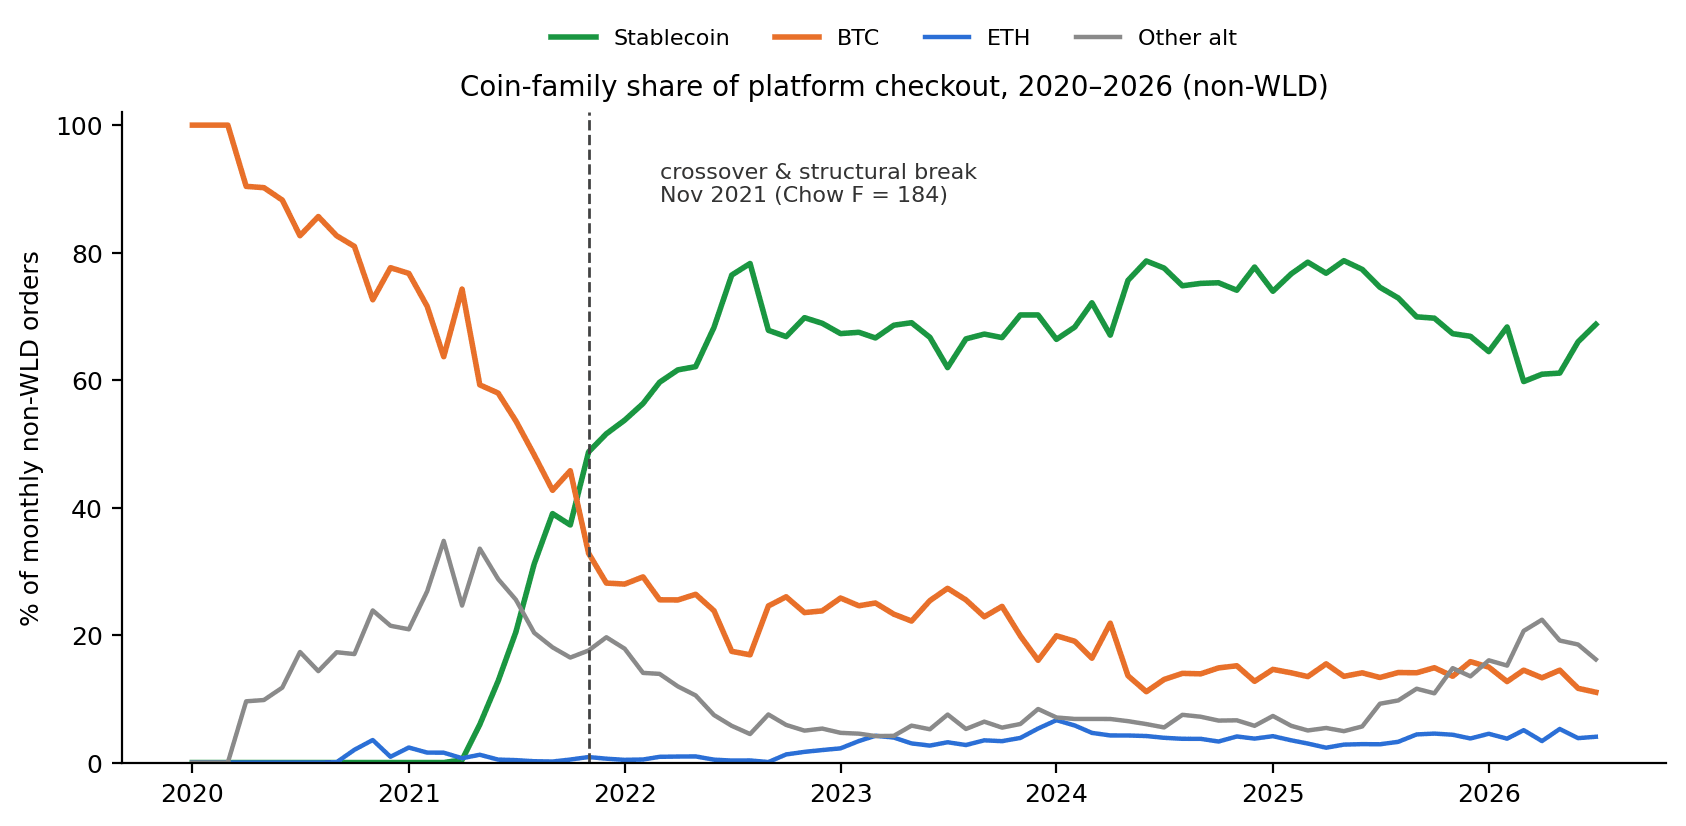
Figure 1 from the paper. Monthly share of completed orders by coin family, 2020 to 2026. Stablecoins overtake Bitcoin in November 2021.
An ironic destination
Put the three findings together and a picture emerges that neither the industry's boosters nor its critics quite predicted. Where crypto has succeeded as a means of payment, it has largely done so in custodial form, through intermediaries, denominated in dollars. That is an ironic destination for a movement founded on disintermediation, and a consequential one for policy. The institutions that matter most for consumer protection in emerging-market crypto spending are not protocols. They are exchanges, entities with account relationships, disclosure obligations and addresses.
A word on method
A word on method, because it shapes what we published. The paper reports compositional shares only, never absolute volumes, and identifies no country by name. Income-group codes replace country identities throughout. This costs the paper some colour, and we accept the cost. A merchant that publishes research from its own ledger owes its customers and partners data minimisation, and owes readers a clear account of what was withheld and why. Researchers who wish to replicate the analysis can request the underlying aggregates under a data-use agreement.
The paper opens a numbered Working Papers series and builds on the consumer research Labs has published since 2021, including the annual Consumer Reports and the Stablecoins in Crypto-Shopping study. The full text is available now as a PDF, and comments are genuinely welcome at info@cryptorefills.com. The gap between what people say about crypto payments and what the till records turns out to be wide. We intend to keep measuring it.
Cite as: Silenzi, M. (2026). The Geography of Real-World Crypto Spending: Evidence from a Global Crypto-Commerce Platform Across 62 Countries. Cryptorefills Labs Working Papers, No. 1, September 2026. doi:10.5281/zenodo.22641350. Download the PDF.