Introducing the 2022 Cluster Analysis

Introducing the 2022 Cluster Analysis
Our 2022 “Full” edition of the “Cryptocurrency in Retail: Consumer Adoption Report” (available here) for the first time features a Cluster Analysis. In this brief article we explain what a cluster analysis is and how it is used for marketing research. We then explain the analytical methodology we used for our research. We conclude by describing the Cluster Analysis section of our Report 2022 by explaining the content and types of charts and data included.
What is a cluster analysis and how is it used for marketing research?
Cluster analysis is a statistical technique used in marketing research to group similar customers or market segments together. The goal is to identify patterns and trends in the data that can be used to inform marketing strategies and tactics.
For example, since we have data on the demographics, purchasing habits, brand and other preferences of a group of customers we can use cluster analysis to group these customers into different segments based on their similarities. The analysis also allows us to infer and describe what makes the members of each group similar to each other (and different from the members of other groups). These segments could be used for actionable marketing purposes, such as adapting the product or pricing to specific target needs or target different marketing messages and promotions to different groups of customers on the best channels and with messages that resonate.
A simple way to think about it is, it’s a way to sort a large group of people into smaller groups based on their similarities, so that you can target your marketing efforts more effectively. While simpler segmentation models are obviously available, for example segmenting based on age, wealth or other single variables. The advantage of Cluster Analysis is to be able to group users based on a group of different variables and based on how these variables influence each other.
2022 report cluster analysis methodology
The specific method used for cluster analysis can vary depending on the type of data and the research question. Some common methods include K-means, hierarchical clustering and density-based clustering. Each method has its own strengths and weaknesses, so the choice of method will depend on the research question and the characteristics of the data.
K-Prototypes is a type of clustering algorithm that is used to group similar data points (or “prototypes”) together. The “K” in K-Prototypes refers to the number of clusters that the algorithm will create.
The algorithm works by first selecting K initial prototypes (usually chosen randomly) and then iteratively assigning each data point to the closest prototype. After each assignment, the prototypes are recalculated to be the center (or “mean”) of all the data points assigned to them. This process is repeated until the prototypes no longer change or a stopping criterion is met.
The main difference between K-Prototypes and other clustering algorithms like K-Means is that K-Prototypes can handle both numerical and categorical data. In other words, it can group together data points that have both numerical values (like age or income) and categorical values (like gender or location).
In simple terms, K-Prototypes is a way of grouping similar data points together by considering both numerical and categorical values. It’s useful when the data you want to group has both types of values.
Our Crypto-shopper survey contains almost 500 questions, but with different types of data (numerical and categorical). In the survey we collect numerical data as well as category data (gender, employment, country of residence, etc.). Therefore K-prototypes is particularly useful due to the type of data we collect.
2022 consumer spending of crypto cluster analysis
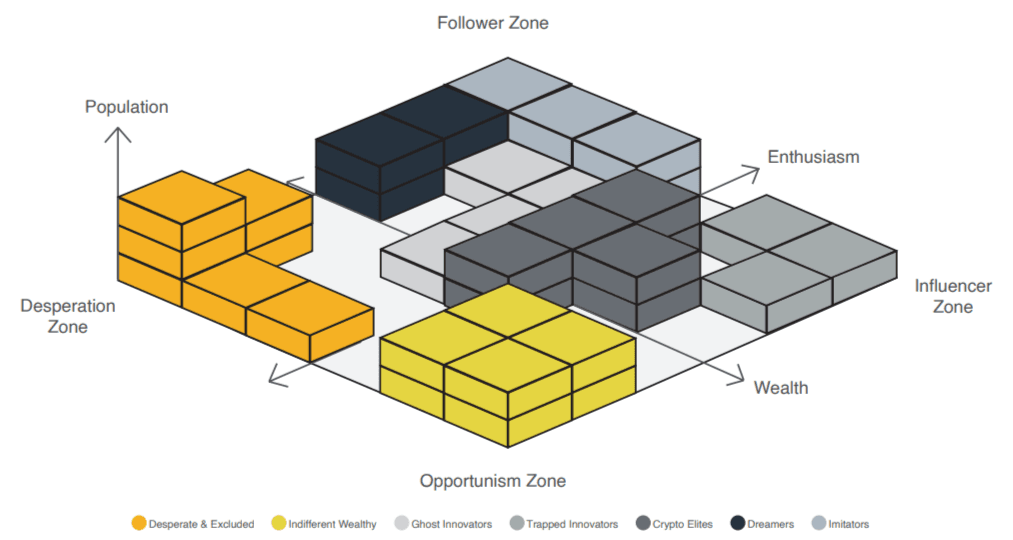
The Cluster Analysis Section of Our Report contains 3 sections. In the first section we provide a chart that identifies seven Crypto Consumer segments and maps them according to 3 macro variables: The first 2 variables: Wealth and Enthusiasm map the segments on the “x,y” plain according to these two macro variables which can explain the main differences between the seven groups. The level of enthusiasm and wealth creates four macro zones into which segments are mapped into. This helps the reader visualise the general relationships and differences between segments. The third dimension which is the height (“z”) describes the population size.
This map allows the reader to get an immediate understanding of how the groups are related to each other, and the density or concentration of each segment.
Figure 1. Crypto-shoppers cluster map from the Cryptorefills Labs Cryptocurrency in Retail: Consumer Adoption Report 2022.
In this first section we also indicate the relative population density for each of the segments. In other words the reader will be able to learn that “Crypto Elites” contains a certain % amount of the Crypto shopper population while the “Indifferent Wealthy” contains a different percentage, and so on.
In the second section of the Cluster Analysis, we describe each of the seven segments identified in detail. For each segment we describe the similarities in demographics, preferences and behaviours among the members of the segment. For example members of a certain segment will present some common traits like a certain level of wealth, or a certain degree of knowledge of blockchain, a preference for certain products etc. Besides a qualitative description of each segment we map each group with respect to their levels of “Enthusiasm”, “Wealth”, “Blockchain Knowledge”, “Education level”, “Population Size” and “Crypto Shopping Frequency”. This allows the user to visualise immediately the similarities within members of the groups and differences with other segments according to these important macro traits.
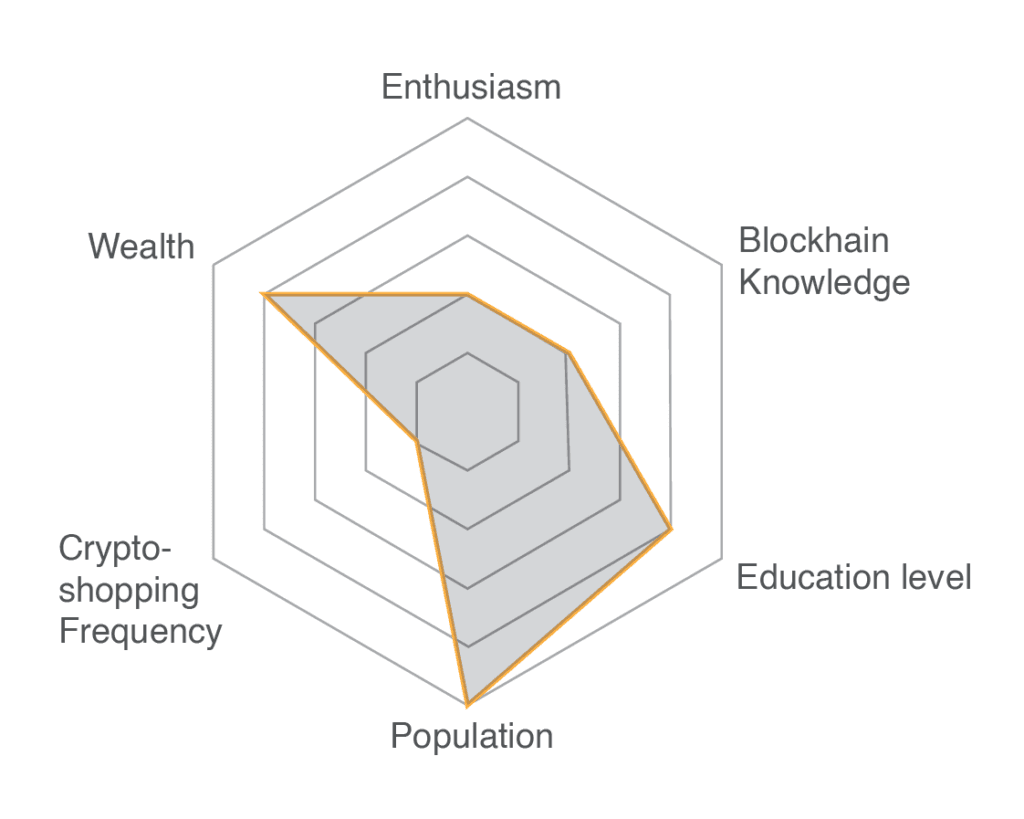
Figure 2. Example of the characteristic features of one segment from the cluster analysis.
Finally in the third section of the Cluster Analysis we reanalyze some of the most important data and charts of the Consumer Report with respect to the segments identified in the Cluster Analysis. For example, in the Report we analysed certain preferences or shopping habits such as use of Lightning Network. While in the first part of the Report we provide the reader with a generic percentage of users that have used “Lightning Network” or a certain percentage of shopper that spend Crypto on a monthly basis or certain cryptocurrency preferences, in the third section of Cluster Analysis we will provide these percentages again but split for each segment. In other words, preferences such as use of Lightning Network or type of products purchased with crypto, or habits such as frequency of spending cryptocurrency, are assessed for each individual segment providing. This is very interesting because a certain preference or habit may be much more prevalent with one or more specific segments, and thus can provide actionable marketing data points.
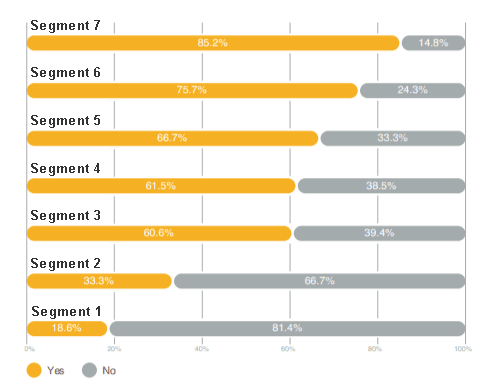
Figure 3. Example of Lightning Network usage by cluster segment.
Get your copy of the cluster analysis
The Crypto-shopper Cluster Analysis is available only on the Full Edition of the Cryptorefills Labs “Cryptocurrency in Retail: Consumer Adoption Report 2022”, you can get your copy here. The Cluster Analysis section of the report contains the high-level mapping and description of the seven segments as well as 36 charts and graphs.
The analysis could be especially interesting for crypto and web 3 marketers as well as payment managers interested in accepting cryptocurrency. Feel free to reach out to our team for any questions through the contact form.
Sources
Anderberg, M. R. (1973). Cluster analysis for applications. New York: Academic Press.
Kaufman, L., & Rousseeuw, P. J. (1990). Finding groups in data: An introduction to cluster analysis. New York: Wiley.
Everitt, B., & Hothorn, T. (2011). An introduction to applied multivariate analysis with R. New York: Springer.
Hahs-Vaughn, D. L., & Nachtigall, R. D. (2010). Cluster analysis in research. Journal of Educational Research, 103(5), 323-337.
Jain, A. K., & Dubes, R. C. (1988). Algorithms for clustering data. Prentice-Hall, Inc.
Chaturvedi, A., & Gupta, M. (2019). A Comparative Study of K-Means and K-Prototypes Algorithm for Categorical Data. International Journal of Computer Applications, 175(4), 16-20.
Huang, Z. (1998). Extensions to the k-means algorithm for clustering large data sets with categorical values. Data mining and knowledge discovery, 2(3), 283-304.